In my commentary on Saturday I asked “Are we there yet?”, meaning has the bottom been reached, and can we start buying again (my answer is yes). Over the weekend some interesting responses were posted on the Buy High Sell Higher Forum.
ULover makes the point that this market is the same as last year; we have seen ups and downs many times before:
Of course, all the hype on CNBC is on the Dow and the big cap darlings but this is EXACTLY what happened last year. After all the markets swooned in May, it was the major markets that came roaring back first and it looked like the uranium small caps were being left in the dust. All last summer, the uranium’s would try to make feeble breakouts, give back their gains and try again. I lost track of how many false breakouts there were last summer. It was very discouraging.Just about the time when an impatient investor would let the CNBC hype get inside their head, be tempted to get out of uranium’s and into the broader market, the uranium’s came to life and pulled ahead significantly for the year.It seems to me that for the uranium’s, this year is playing out exactly like last year.This echoes what other’s have said; for example, davidslane has many posts, such as this one, predicting that we have bottomed and will rise through most of August.
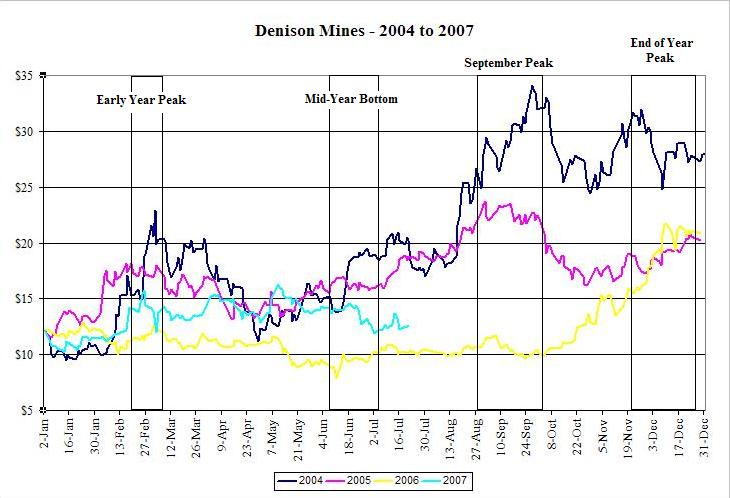
This echoes what other’s have said; for example, davidslane has many posts, predicting that we have bottomed and will rise through most of August.So, is it the same as last year? To study this, I created some charts of DML.TO – Denison Mines Corp.; here’s a chart showing activity since January 1, 2004, adjusted so that the price was the same at the beginning of the year. (Click here if you want to see a larger version).
This echoes what other’s have said; for example, davidslane has many posts, predicting that we have bottomed and will rise through most of August.So, is it the same as last year? To study this, I created some charts of .; here’s a chart showing activity since January 1, 2004, adjusted so that the price was the same at the beginning of the year. ().
Traditionally there is an early year peak in February, a bottom around June, a peak in September, and then a peak around the end of the year. Obviously these timings are not precise.
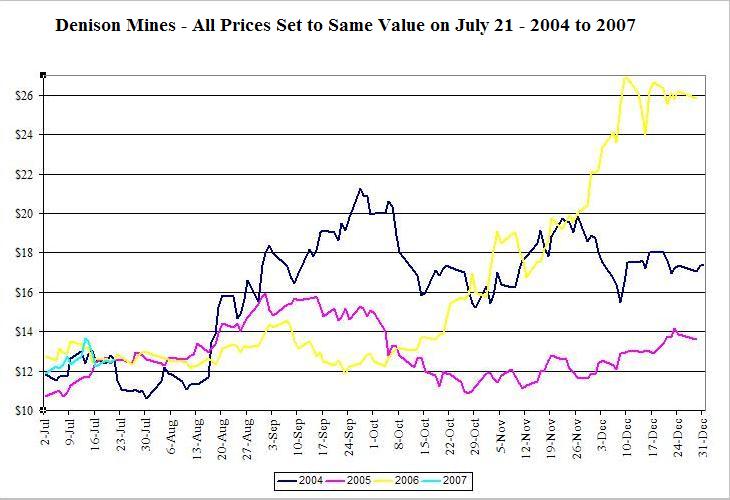
To make it clearer, (or to confuse you even more), I then took the same chart and set the prices to the same level as Denision reached on July 21, 2007 ($12.60). This chart runs from the start of July to the end of the year. (Click here to see a larger version).

As you can see, 2004 (the blue year) was a great year; if history repeats itself, Denison will hit $21.25 on September 27.
In 2005 (the purple year), using my adjusted numbers, Dension peaked at $15.92 on September 1; not a great year, but better than where we are at.
Last year, 2006 (the yellow year), Denison had a top at $14.57 on September 7, corrected down to $11.90 on September 23, and then peaked at $26.87 on December 10.
(Again, I have adjusted the numbers so that July 21 is at the same level in each year. On September 23, 2006 Denison did not really peak at $26.87 on December 10; it actually peaked on December 10 at $12.26; it’s the relative numbers that matter).
The point, and there is one, is that yes, history does repeat itself. It does not repeat itself exactly; each year is different. However, in each of the last three years Denison was higher on Labour Day (or Labor Day for you non-Canadians) than it was on July 21.
I have not repeated this analysis for every uranium stock, but I believe if I did the results for many of them would be similar.
The point: now is the time to buy, not the time to sell.
{ 0 comments… add one now }
You must log in to post a comment.
{ 1 trackback }