It would appear that next week we will be in rally mode, hard as that may be to believe.
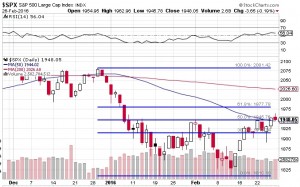 As documented last week, the Fibonacci Retracement levels put a significant resistance level at around 1,946 on the S&P 500. As a refresher, this is simply the Fibonacci levels drawn from the peak in the last week of December to the trough in the middle of February. That 1,946 level also corresponded to the intermediate, intra-day peak on February 1.
Various other commentators, using various other systems, had their resistance levels around 1,940, but the impact is the same: A close above that level signals the market could go on a run, perhaps up to the next levels at 1,977 and 2,081.
Well, guess what. That’s what the charts are now saying, strange as that may seem. Hard to believe that with the DOW down 4.2% year to date, and the S&P 500 down 4.5% year to date, we could be on the verge of a rally, but that’s how it looks.
So, how do you play it?
First, you recognize that we are in a bear market, so this rally will likely not last very long. Get in, take your profits, and get out. That’s my plan. I bought some UPRO – ProShares UltraPro S&P 500; it aims for a return of 3X the move on the S&P 500, to the long side, so if the SPX is up 1%, UPRO should be up 3%.
I will hold them until the chart pattern above breaks down, or until we approach the resistance levels, at which point I will take my profit and run.
I’m also holding gold, which is very strong so far in 2016.
That’s the plan. More next week.
Stock Market Rally in Early March?
by JDH on February 27, 2016
It would appear that next week we will be in rally mode, hard as that may be to believe.
Various other commentators, using various other systems, had their resistance levels around 1,940, but the impact is the same: A close above that level signals the market could go on a run, perhaps up to the next levels at 1,977 and 2,081.
Well, guess what. That’s what the charts are now saying, strange as that may seem. Hard to believe that with the DOW down 4.2% year to date, and the S&P 500 down 4.5% year to date, we could be on the verge of a rally, but that’s how it looks.
So, how do you play it?
First, you recognize that we are in a bear market, so this rally will likely not last very long. Get in, take your profits, and get out. That’s my plan. I bought some UPRO – ProShares UltraPro S&P 500; it aims for a return of 3X the move on the S&P 500, to the long side, so if the SPX is up 1%, UPRO should be up 3%.
I will hold them until the chart pattern above breaks down, or until we approach the resistance levels, at which point I will take my profit and run.
I’m also holding gold, which is very strong so far in 2016.
That’s the plan. More next week.