For some perspective, let’s start with a look at a twelve year chart of gold:
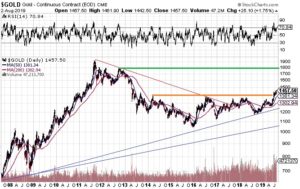
Looks pretty good. On August 1, 2007 gold traded at $645. By September 1, 2011 it hit over $1,920. That’s a nice triple in four years, but from there the correction began, culminating in a drop to $1,046 at the end of November, 2015. The good news: Gold never broke below $1,000, as many had predicted, so $1,000 is very solid support, that has held since October, 2009.
And then the consolidation period began. From February 2016 through June of 2019 gold traded in the range of $1,121 and $1,375. $1,100 was support; $1,400 was resistance.
The resistance ended on June 20, 2019 when, for the first time Since September 2013, gold traded above $1,400. Gold has had some ups and downs since then, but it would appear the new base is around $1,380, and the new upper level resistance is $1,450.
But wait! Gold closed at $1,457 on Friday. So much for that resistance level.
There are no solid resistance levels on the chart until $1,800, so next stop: $1,800.
How to play it?
Let’s start with my favorite highly leveraged gold play: NUGT – Direxion Daily Gold Miners Index Bull 3x Shares, because 3 times the leverage is better than 1 or 2!
A 10 year chart is more stark, showing that, unlike with gold itself, the main down trend has not yet ended:
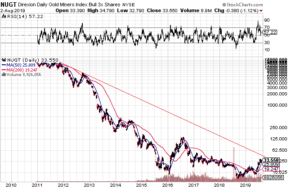
However, since the down trend has ended for gold, NUGT is sure to follow. It’s not clear from the chart, but on an adjusted bases in September 2011 NUGT was trading at an equivalent of over $17,000 per share.
Yup, that’s leverage.
A one year chart is more instructive:
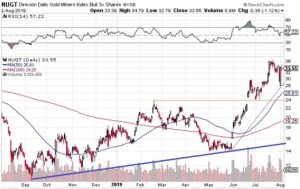
The uptrend line could take NUGT down to $16. The 200 day moving average is at $19.25, and the 50 day moving average is at $25.81
On Thursday NUGT briefly “crashed” down to $28, before recovering to almost $35.
NUGT is volatile, which makes it a fun, if dangerous, vehicle for playing gold.
Here’s my plan:
I already own some NUGT, but I want more, so I’m placing my next buy order at $30.75, which is just above the .236 fib retracement level.
The next buy order will be at $27, just abovet he 38.2% level at $26.78.
Here’s the Fibonacci chart:
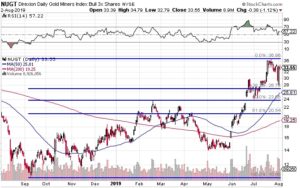
And yes, I realize this is all mumbo-jumbo, and fib levels are not particularly predictive, but given the volatility of NUGT, it does not make sense to take a full position now.
Take an initial position now; the RSI is at 57, which is a good, but not great, entry level.
So if you want a 1000 share position, perhaps place orders as follows:
300 at $33.50 to take an initial position
200 at $30.75
200 at $27
100 at $18
100 at $16
100 at $14
I doubt the $14 order gets filled, but NUGT was around $14 in May, so it is possible.
Place your bets, and watch the fireworks.
If you want a less risky way to play gold, my favorite gold stock is EQX.V – Equinox Gold Corp.:
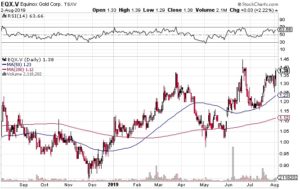
It was a fantastic buy at 80 cents before Christmas, and if it can decisively clear the resistance around $1.40 I see it as a $2 stock before the end of the year.
(But I said that last year, too, so what do I know?).
I have a big position, and I hope for great things.
To summarize: gold is looking good, so place your bets.
The weather here in Southern Ontario looks fantastic on this civic holiday weekend, so now, time to enjoy it. More next week.
{ 1 trackback }