Deep Dive on Gold
by JDH on December 14, 2019
Okay, not a really deep dive, but let’s take a look at two charts.
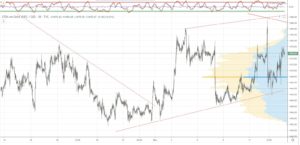
First, a 1 year chart of gold:
The bottom over the last twelve months happened in August 2018 around $1,160, and then gold got close to $1,560 in August of this year before correcting down to almost $1,440 last month. Gold has recovered to $1,475 today.
(It’s interesting, although likely meaningless, that both the high and low in gold happened during the month of August).
The long uptrend remains intact anywhere above $1,380, but gold needs to close above $1,500 to prove that the medium term down trend has ended.
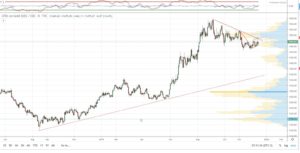
Here’s a closer look:
There was a lot of volatility this week, with gold bouncing around on China trade deal rumors, and the election in the UK. Gold has settled into the channel between $1,460 and $1,490, but it is encouraging to see both higher lows and higher highs in the last month.
How will it resolve?
I have no idea, but I’m holding, but not doing any new buying, so we will wait and see.
Thanks for reading; more next week.
Deep Dive on Gold
by JDH on December 14, 2019
Okay, not a really deep dive, but let’s take a look at two charts.
First, a 1 year chart of gold:
The bottom over the last twelve months happened in August 2018 around $1,160, and then gold got close to $1,560 in August of this year before correcting down to almost $1,440 last month. Gold has recovered to $1,475 today.
(It’s interesting, although likely meaningless, that both the high and low in gold happened during the month of August).
The long uptrend remains intact anywhere above $1,380, but gold needs to close above $1,500 to prove that the medium term down trend has ended.
Here’s a closer look:
There was a lot of volatility this week, with gold bouncing around on China trade deal rumors, and the election in the UK. Gold has settled into the channel between $1,460 and $1,490, but it is encouraging to see both higher lows and higher highs in the last month.
How will it resolve?
I have no idea, but I’m holding, but not doing any new buying, so we will wait and see.
Thanks for reading; more next week.