So here’s where the S&P 500 closed on Friday:
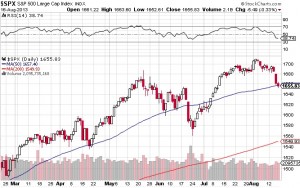
Did we have a top? Probably not, although we are around 100 points below the top at the beginning of the month, so the first two weeks of August have not proven profitable for investors in the market. The SPX is now below it’s 50 day moving average, but as you can see from the chart that has happened twice before in the last six months, and the market bounced to new highs thereafter, so this may be yet another correction on the way to new highs. We shall see.
The gold chart is somewhat more instructive, perhaps:
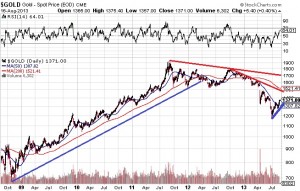
We all realize that the steady bull market appeared to end with a consolidation in 2011 and 2012, followed by a collapse in 2013, with gold trading below $1,200 for the first time since 2010. However, Friday’s close at $1,371 shows that gold is not dead yet, and a bounce of almost $200 from the lows could indicate that the bottom is in.
The action in silver has sparkled. Silver Wheaton broke below it’s consolidation range, but has had a healthy recovery of late:
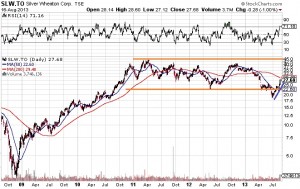
I am a long term investor in SLW, and with a close in Toronto at $27.68 on Friday, I think it’s time to start nibbling again, perhaps around the $22.60 level, which is the 50 day moving average. I would not buy at these levels, since with a huge run up this week, a small correction is inevitable.
I long ago stopped attempting to predict the future, but with the general markets under pressure, and with the precious metals having a great week, it is very possible that the implosion we have long expected is beginning.
Or not.
It’s the summer, volumes are light, so this week’s action may mean nothing.
Personally, I’m not selling any precious metals stocks that I own, and I will be accumulating on further weaknesses, because I don’t see much downside from here.
Stay the course.
See you next week.
Sure Looks Like a Top and Bottom
by JDH on August 17, 2013
So here’s where the S&P 500 closed on Friday:
Did we have a top? Probably not, although we are around 100 points below the top at the beginning of the month, so the first two weeks of August have not proven profitable for investors in the market. The SPX is now below it’s 50 day moving average, but as you can see from the chart that has happened twice before in the last six months, and the market bounced to new highs thereafter, so this may be yet another correction on the way to new highs. We shall see.
The gold chart is somewhat more instructive, perhaps:
We all realize that the steady bull market appeared to end with a consolidation in 2011 and 2012, followed by a collapse in 2013, with gold trading below $1,200 for the first time since 2010. However, Friday’s close at $1,371 shows that gold is not dead yet, and a bounce of almost $200 from the lows could indicate that the bottom is in.
The action in silver has sparkled. Silver Wheaton broke below it’s consolidation range, but has had a healthy recovery of late:
I am a long term investor in SLW, and with a close in Toronto at $27.68 on Friday, I think it’s time to start nibbling again, perhaps around the $22.60 level, which is the 50 day moving average. I would not buy at these levels, since with a huge run up this week, a small correction is inevitable.
I long ago stopped attempting to predict the future, but with the general markets under pressure, and with the precious metals having a great week, it is very possible that the implosion we have long expected is beginning.
Or not.
It’s the summer, volumes are light, so this week’s action may mean nothing.
Personally, I’m not selling any precious metals stocks that I own, and I will be accumulating on further weaknesses, because I don’t see much downside from here.
Stay the course.
See you next week.