I have no idea. Here’s a long term chart:
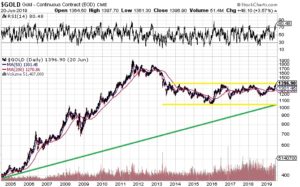 We all know the story: gold went from under $400 in 2005 to $1,900 in 2011, and that was it. Gold then took two years to drop into a trading range between $1,050 and $1,375, and that’s where it stayed, for 5 years, until this week.
For the first time since March, 2014 gold traded above $1,400 US, albeit briefly.
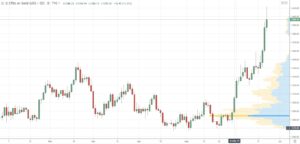
The year to date chart is impressive, with a big spike above $1,400 (but that’s how it works with a five year high).
So now what?
$2,000 by Canada Day?
Nope.
That’s not how it works.
My guess is that this is a big, fast move, and a pullback is necessary, so I liquidated most of my holdings of NUGT on Friday, and I’m sitting on cash, ready to redeploy on weakness. I like cash. Cash is king.
That being said, I did not sell any of my gold stock holdings, including my largest holding: EQX.V – Equinox Gold Corp.
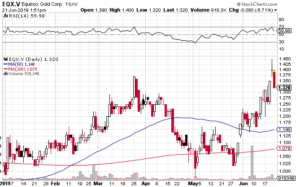
From a low under $1.00 (both at the start of the year and again in May), the rocket ride commenced, taking Equinox to $1.45, before settling back in the $1.30 range.
Nice run.
I think, after a pause, Equinox has a lot more room to run, and I expect it to be a $2 stock before the end of the year.
Of course I expected it to be a $2 stock last year, and I was totally wrong, so govern yourselves accordingly.
My order of battle is:
- hold a few puts on Tesla, since I want to have something when it goes bust;
- liquidate the majority of my holdings in Canadian pot stocks, which have had their run, and switch some of those funds into US pot stocks; and
- buy gold stocks on weakness.
That’s the plan. We’ll see how it goes. More next week.
{ 1 trackback }